Gathering requirements for Visualizations

I and my colleague Evan  have interviewed graduate student Jon Komperda, who works at Computational Multiphase Transport Labratory (CMTL) about his work  and gathered requirements (visualization ideas and combustion data) from him we had an opportunity to visit his lab and learn about the his studies.

Some notes about Undergraduate Research in Electronic Visualization Lab (EVL)

Orientation at EVL

I had my first orientation to EVL on May 15th 2015 with other 5 undergraduate UIC students, We met our adviser Prof. G.Elisabeta Marai  and discussed our plans for this REU and toured the lab and talked with some of the graduate students in the lab. We got our keys to the lab too !

Writing a semester plan

I wrote a semester plan for this REU  and laid out my plan about learning different programs and visualization tools, reading assignments, due dates , prototype presentation dates.  

Completing tutorials

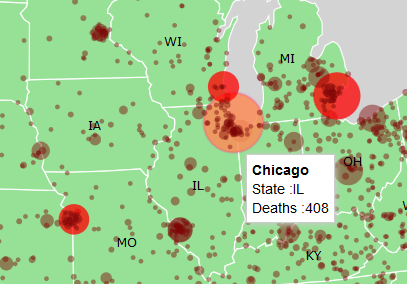
We completed lots of tutorials during this REU , I have learned  Javascript ,HTML, Git  from different sites and also completed a tutorial on how to visualize data with D3, how to build 3D models with sketchup,how to program in python and work with Omegalib.  

Attending tech talks on Fridays

Fridays are for tech talks in EVL. Every Friday afternoon different people in the lab give tech talks about different tools and technologies that they specialize on. I had an opportunity to learn a lot about Linux (I actually started using Ubuntu!  ), Advanced D3, javascript and Unity game engine and many other.  

Attending Wed EVL meetings

Wednesdays are for EVL meetings,students brief about their progress and grad students give a 30 minute talk about their research topics.  These meetings are very educational and gave me an insight about what graduate student do.

Our first combustion data visualization prototype

After tinkering for a while we were able to show our combustion visualization for the domain experts from the Computational Multiphase Transport Labratory (CMTL). We received a simulation data for shock tube flow from experts and had discussions about the data which contains different parameters such as temperature, velocity and position for 68,000 particles. We used Omegalib , an opensource software developed in EVL , which is great framework for visualization in immersive virtual realities and  large displays. We wrote python script that parses the parameters from the provided data and loads the model to the CAVE2 for visualization.

The domain experts were very happy to see their work in an immersive 3D environment for the first time. They were able to quickly point out some problems on the data, the visualization made it very easy to spot out missing particles and it enabled them to review their simulations.

Here are some pictures I took while the experts looking our prototype and discussing about the combustion data

20150717_145737

The combustion visualization prototype in CAVE2

20150717_151632

From left to right,  Prof. G.Elisabeta Marai, Prof. Farzad Mashayek and PhD student Jonathan (Jon) Komperda looking at the Tube shock flow visualization in the CAVE2

20150717_151621

20150717_152205

Prof. Farzad Mashayek  zooming the tube shock flow model using the CAVE2 controller.

Our next goal is create animation of the tube shock flow using different time steps.

CAVE 2 Immersive Virtual Reality System in EVL

One of the coolest systems we are going to be working on for this REU is CAVE 2. It is one of the very few immersive virtual reality systems in the world. It is located in Electronic Visualization Labratory (EVL) in UIC.

According to EVL website :

CAVE2 is approximately 24 feet in diameter and 8 feet tall, and consists of 72 near-seamless passive stereo off-axis-optimized 3D LCD panels, a 36-node high-performance computer cluster, a 20-speaker surround audio system, a 10-camera optical tracking system and a 100-Gigabit/second connection to the outside world. CAVE2 provides users with a 320-degree panoramic environment for displaying information at 37 Megapixels in 3D or 74 Megapixels in 2D with a horizontal visual acuity of 20/20 .

Visualizing Gun Related Death in US (2013)

One of the new tools that I have started to learn right away in this REU was D3 library. It is really interesting java script library that enables developers to create 2D visualizations that are driven by data. I have also learned Javascript and CSS to integrate my visualization to a webpage.

I have used a CSV file that contain personal information and geographical locations of gun victims in different part of the US. I have also used Datamaps, a jquery library that provides easily customizable SVG maps, and D3 to parse the data and place circles according the longitude and latitude . The size and colors of the circles change according to the number of the victims. As the number increase the circle becomes more red and the size increases.

GunDeathVis

I have also tried to make the map interactive. The map will highlight a state when a user hovers a mouse pointer on top of it. stateClick

The user can also hover their mouse pointer to a city to see more information such as city name, state and gun deaths.

cityClick

We have learned that Chicago, IL had the most victims in that year. It has the biggest circle on the map. You can also see that the major cities have higher number of victims.

As future work,  I am thinking to display the circles by counties rather than cities and a better color scheme for better visualization.

Greetings Everyone !

Hi, this is Brook . I am undergraduate computer science student at university of Illinois at Chicago (UIC). I will be updating this blog about my undergraduate research which focuses on visualizing spectral information in turbulent combustion simulation datasets in an immersive environments.